Connect SERPROBOT with Google Data Studio
Google Data Studio is a tool for creating reports that collect and display data in real time. The tool has a variety of visualization options and allows you to create easy-to-use dashboards quickly. Interactive reports include charts, links, clickable images, and more, customized to your needs.
Google Data Studio connectors allow you to pull data from a variety of sources including Google Analytics, Google AdWords, and Google Sheets. This allows you to centralise and create dashboards that cross-reference data from different solutions.
- Data from many sources
- Customisable Dashboard
- Collaborative tool
- Real-time updated data
If you cant find the information you are looking for or need support then just contact us here
Connect SERPROBOT with Google Data Studio
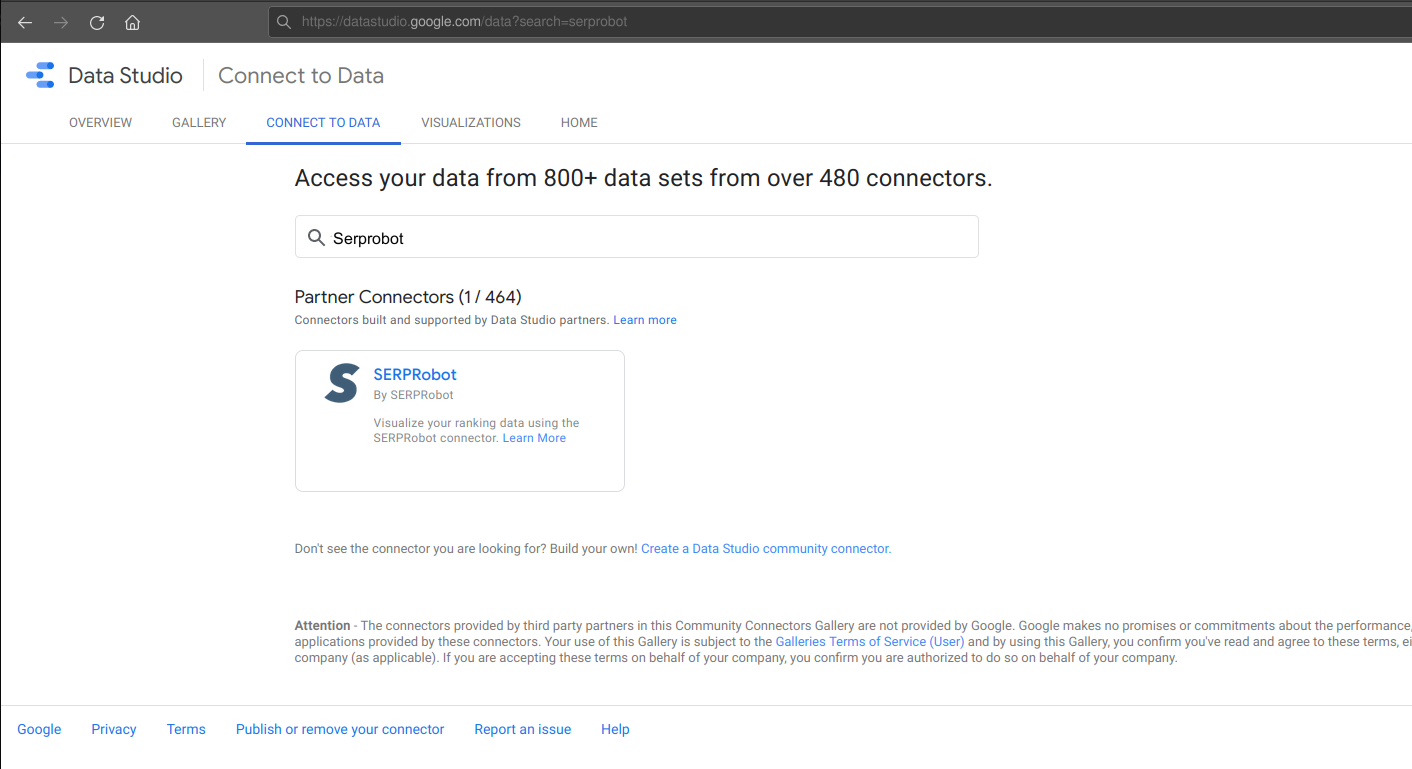
Find our connector by searching in the Google Data Studio data sources for "serprobot" https://datastudio.google.com/data?search=serprobot
Or click the "Apply Connector" button above.
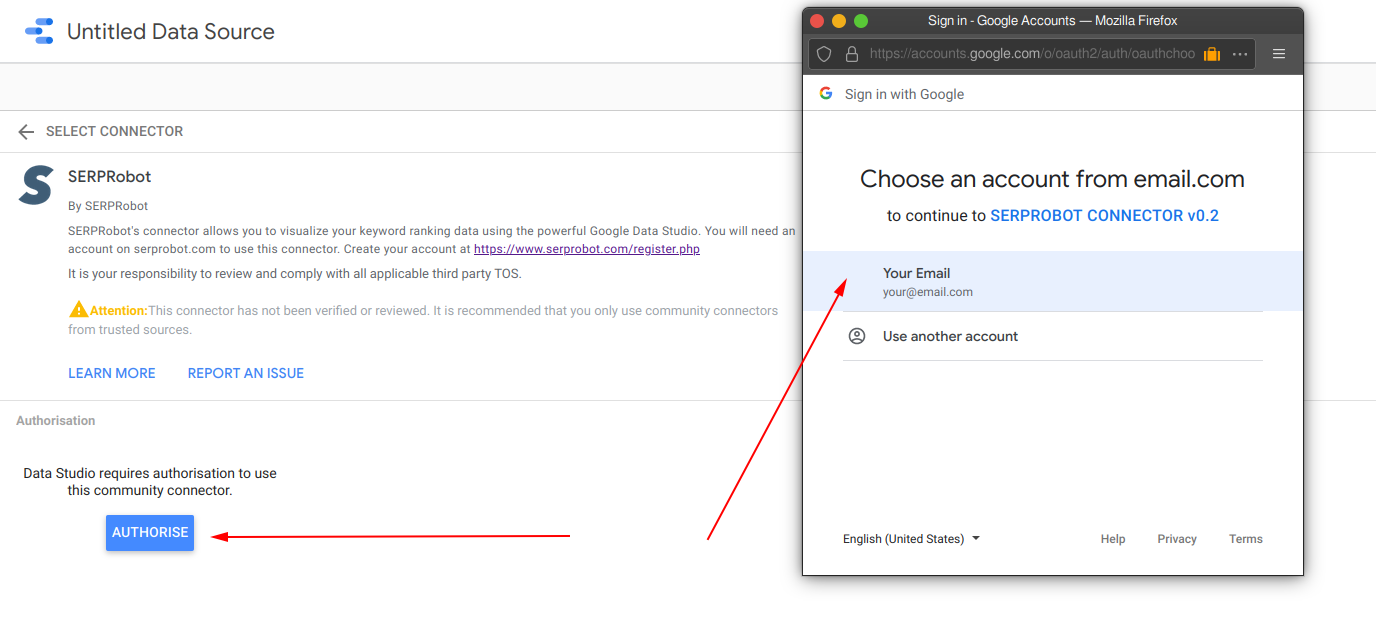
Click on the "AUTHORISE" button to show the OAuth popup and then select the Google account you wish to use the connector with.
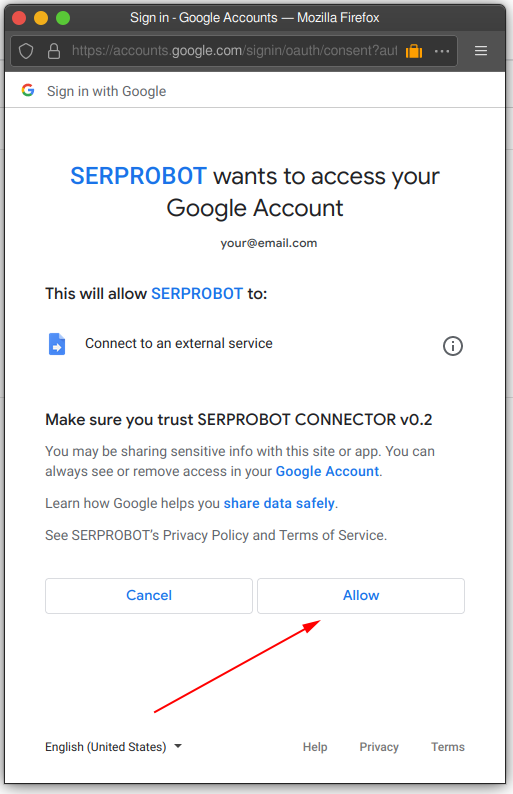
Review the permissions required and click the "Allow" button.
The connector only requires permission to access our API (an external data source) and does not have any access to your Google account or any of your other data.
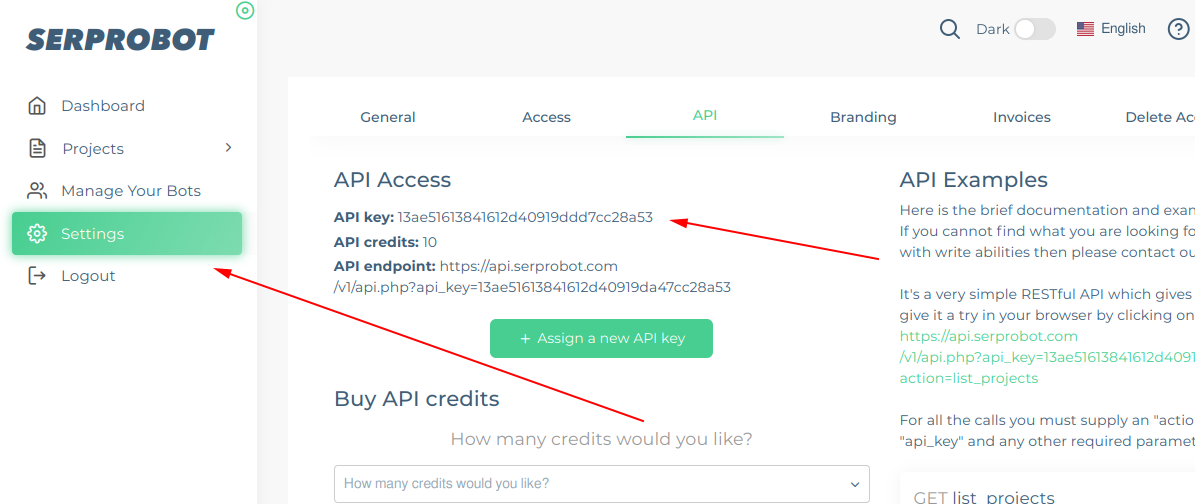
Find your SERPROBOT API key which will be used to access your saved data by clicking on your account settings and then the "API" tab.
Accessing the API to read data is 100% free so you dont require any additional API credits.
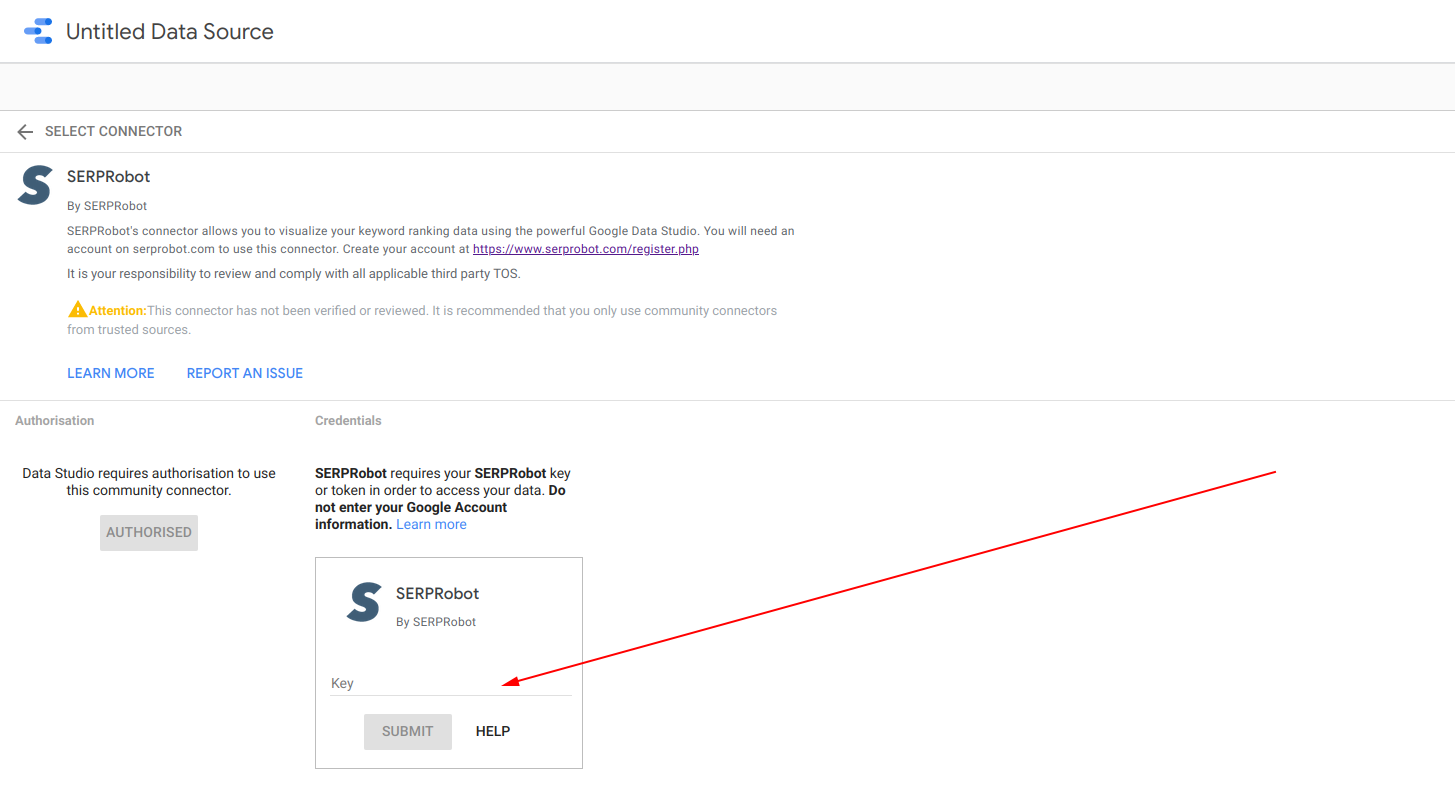
Enter your SERPROBOT API key into the "key" field and click the "Submit" button.
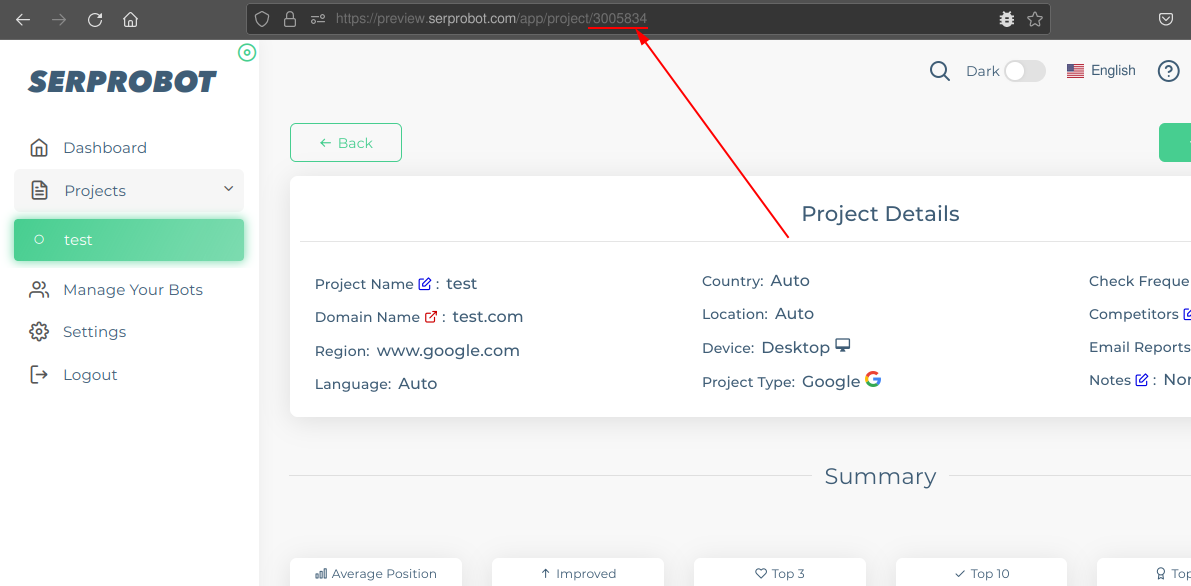
Find your SERPROBOT project id for the project you wish to use in the Data Studio report.
This is the number shown in the url when you view the project's details.
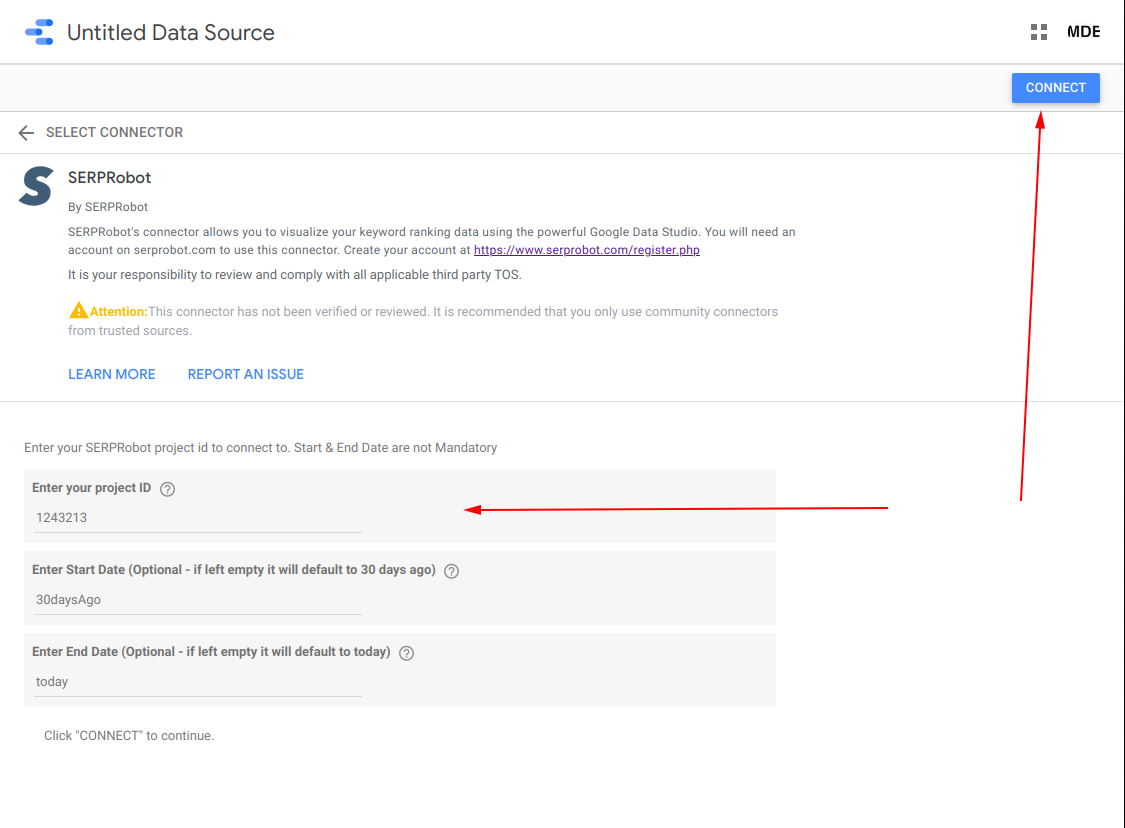
Enter the project id and the start and end date for the data you wish to use in the report.
The "start" date is the the earliest date for the data in the report - This can be a fixed date in the format YYYY-MM-DD e.g. 2021-01-01 or a string in the format "xdaysAgo" to give you a rolling date window e.g. 20daysAgo. This will default to 30daysAgo so the data will start from 30 days in the past.
The "end" date is the latest date for the data in the report - This can be a fixed date in the format YYYY-MM-DD e.g. 2021-06-01 or a string in the format "xdaysAgo" to give you a rolling date window e.g. 1daysAgo. This will default to today so the data will end at today (you will have all of the latest data).
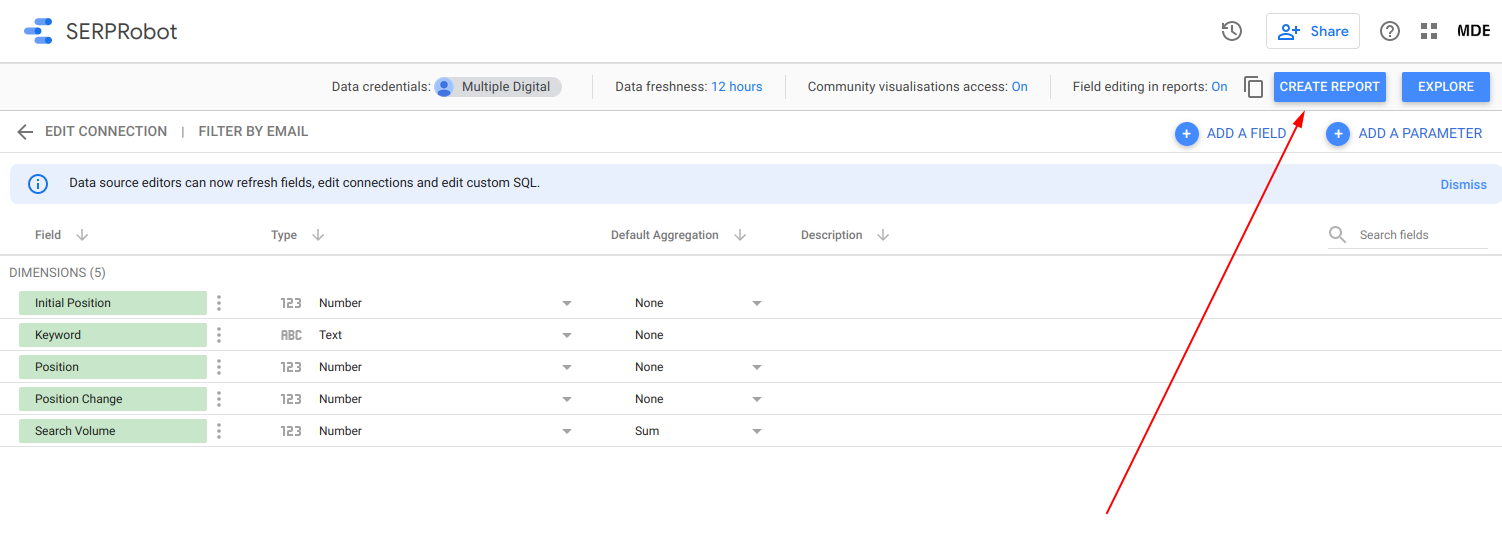
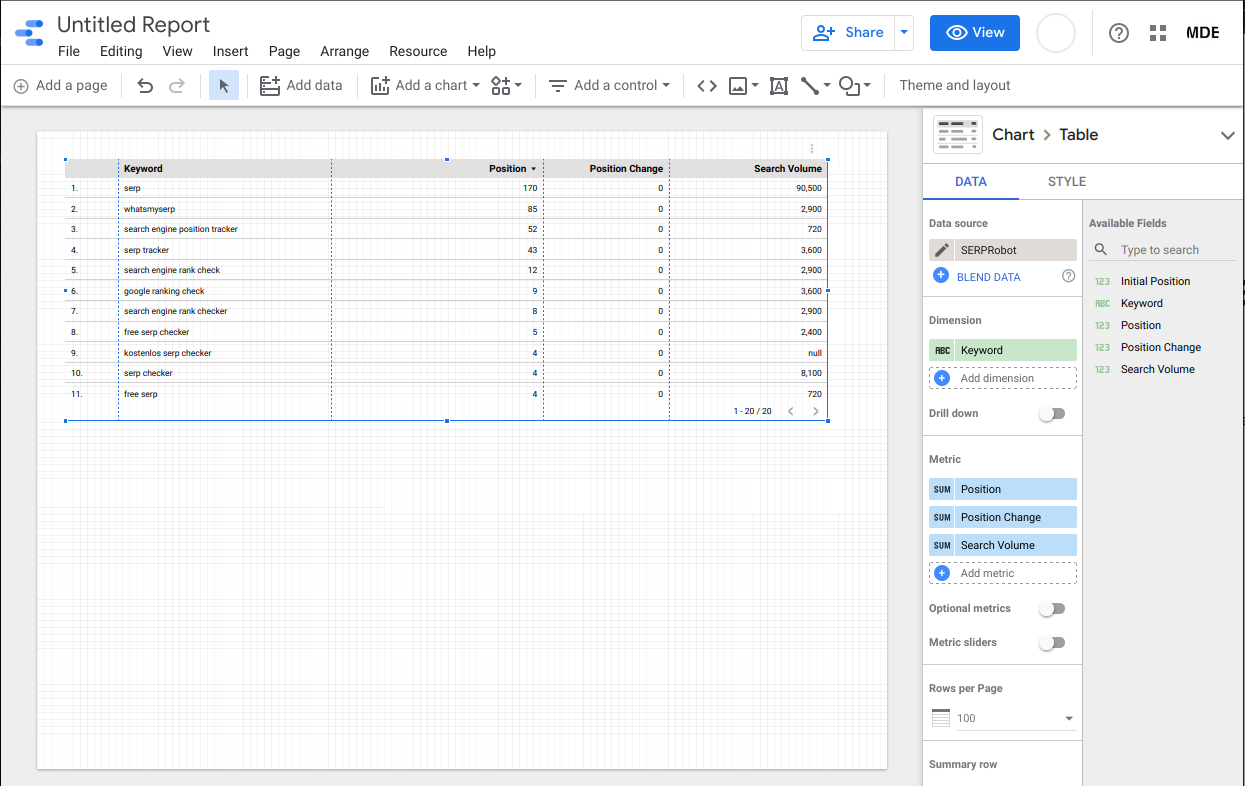
Edit the dimensions that are provided by the connector if you need to and click the "CREATE REPORT" button.
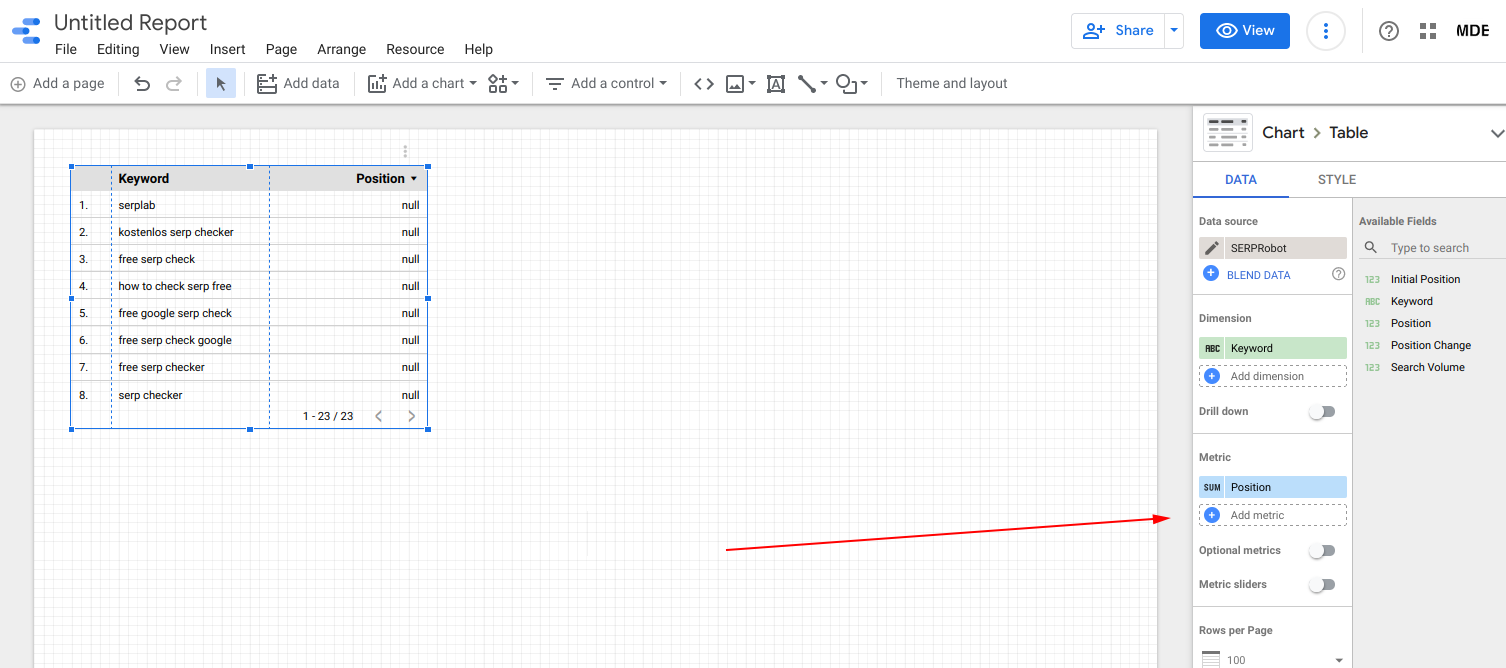
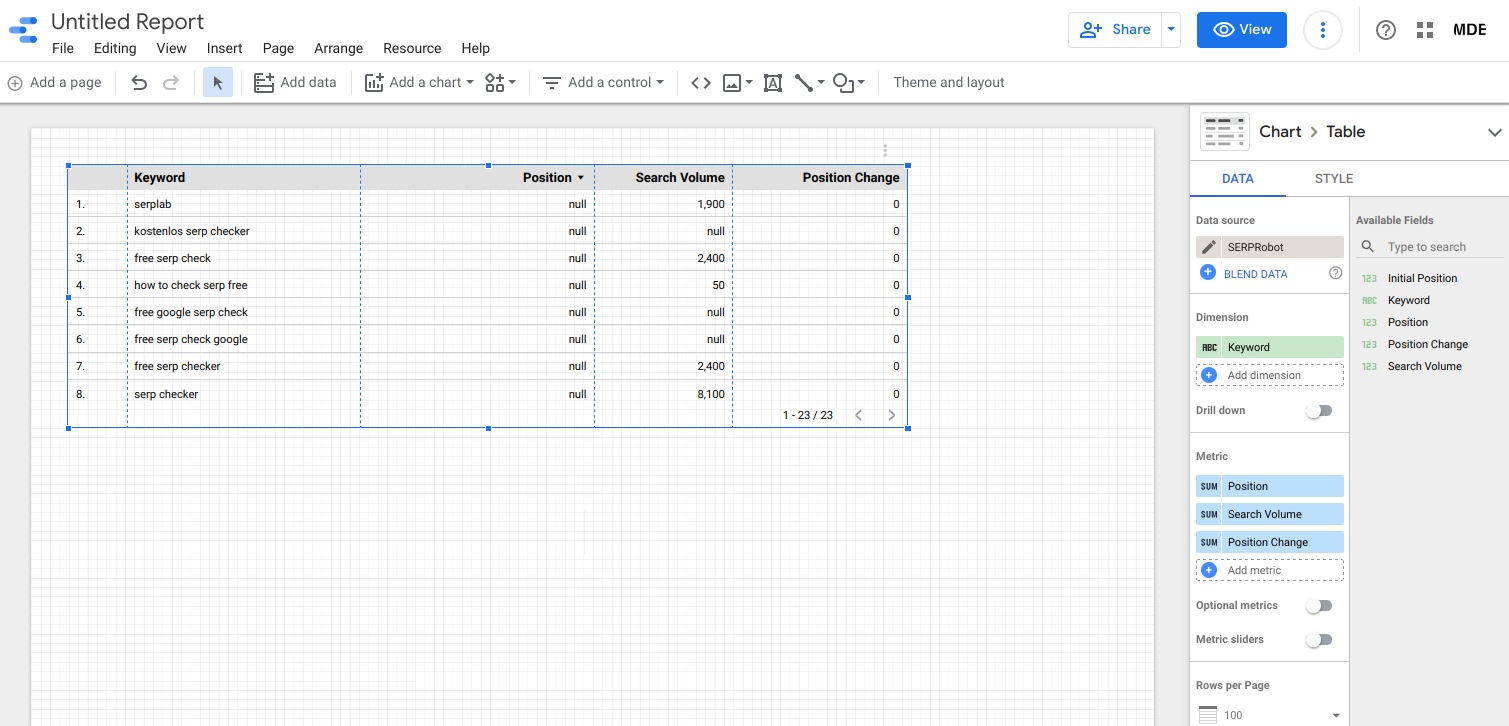
You will now see the default data from the connector displayed as a table and you can add metrics or dimensions as you need to.
Done :-)
If you have any problems or questions please contact us just contact us here or drop us an email at info@serprobot.com